Search This Blog

Saturday, 4 April 2020

polar Plot: bcas_JK_polar


Dear students this is  a video regarding polar plot. In the last session of this video, I have equated the real part  Re (G(jw)) = 0 to determine the frequency (here w= sqrt(2))   at which the polar plot intersects the imaginary axis and then put this value in imaginary part to  determined the value of G(jw)  (in this case it is [(4*sqrt(2))/3]at the point of intersection. This video is taken by phone so it's not so clear but i have tried  to do my best with available of limit  number of resources at home.

Hope for  your healthy life.
Stay home, stay safe

Jitender Kumar


Friday, 3 April 2020

How to find G(s) from the Bode Plot Bcas_JK_G(s)


Dear Students if you have any doubts after seeing this video , plz clarify  or ask me to edit and resend again.

best wishes

Jitender

Thursday, 2 April 2020

Resonant peak conditions : asked

Conditions  for resonance


Bode Plot: Questions for practice

All students are required to do the practice questions given today and yesterday till coming sunday
If any doubt  plz clarify . You are required to plz follow your reference books.

Q1. Sketch the bode plot and find the stability of the system for the following functions:

  1. G(s) = 50/(s+1)(s+2)
  2. G(s) = 50/[s^2(s+1)(s+2)]
Q2. Define the following:  (i)  Bode Plot,  (ii) Gain Marging ,(iii) Phase margin
,    (iv) Gain cross over frequency and (v) Phase cros over frequency
Q3  What information you get from Bode's plot.
Q4  State advantages of Bode Plot

Wishes for  your Healthy  life.

jitender, BCAS


Bode Plots


Gain Margin and Phase Margin

"GM/PM tells how much system can tolerate before going unstable!!!    "

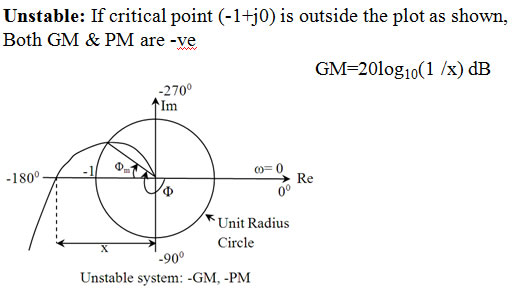
Phase Margin (PM):
Phase margin is that amount of additional phase lag at the gain crossover frequency required to bring the system to the verge of instability (marginally stable)
  Φm=1800
  Where
  Φ=∠G(jωg)
  if   Φm>0 => +PM  (Stable System)
  if   Φm<0 => -PM  (Unstable System)


A Bode plot is a (semilog) plot of the transfer function magnitude and phase angle as a function of frequency. The gain magnitude is many times expressed in terms of decibels (dB)
A decade is defined as any 10-to-1 frequency range
     dB = 20 log10 A    where A is the amplitude or gain
Straight-line approximations of the Bode plot may be drawn quickly from knowing the poles and zeros
response approaches a minimum near the zeros
response approaches a maximum near the poles
The overall effect of constant, zero and pole terms

                Term
     Magnitude 
Break
Asymptotic
 Magnitude Slope
Asymptotic
 Phase Shift
          Constant (K)
            N/A
0
0°
            Zero  
           upward
+20 dB/decade
+ 90°
          Pole
          downward
–20 dB/decade
– 90°

Basic Plots  : Cases


..................................................................................................................................
Note :  All the data shown in this page  is  taken from the reference books given in your syllabus. (Ref book: Manke/ J Nagrath , B C Kuo and from  google also)
..........................................................................................................................................
After reading this plz see this  video for more clarification
Viseo for how to draw Bode Plot
 https://www.youtube.com/watch?v=N9wxx6JPR_w

Wednesday, 1 April 2020

Polar Plot: Questions for Practice

Video  link for polar plot
https://www.youtube.com/watch?v=vZVaHxicUdY
1. Sketch the Polar plot for the following functions:

  1. G(s) = 1/(1+s)
  2. G(s) = 10/s(1+s)
  3. G(s) = 8/(s+1)(s+2)
  4. G(s) = 14/s(s+1)(s+2)
  5. G(s) = (1+6s)/(1+2s)
Appr. Sketches to above   functions 


2. What is Polar plot? Write steps to plot Polar plots.
3. Write applications of Polar plots.

Note: Read the notes provided to you today in your group and if any doubts/confusion you can comment/ Call and email me.
Hope for your safe and healthy life

With Best wishes
jitender


Polar Plots

Students are  required to see the video related to polar plot posted already in this blog


The Polar plot of a sinusoidal transfer function  is a plot of the magnitude of  versus the phase angle of  on polar coordinates as  is varied from zero to infinity. An advantage of using polar plot is that it depicts the frequency response characteristics of a system over the entire frequency range in a single plot.

Steps to draw Polar Plot 


Example