Procedure to plot Root locus
Step: 1 Determine the branch number of loci.
Step:
2 Plot the poles and zeros on
the S plane
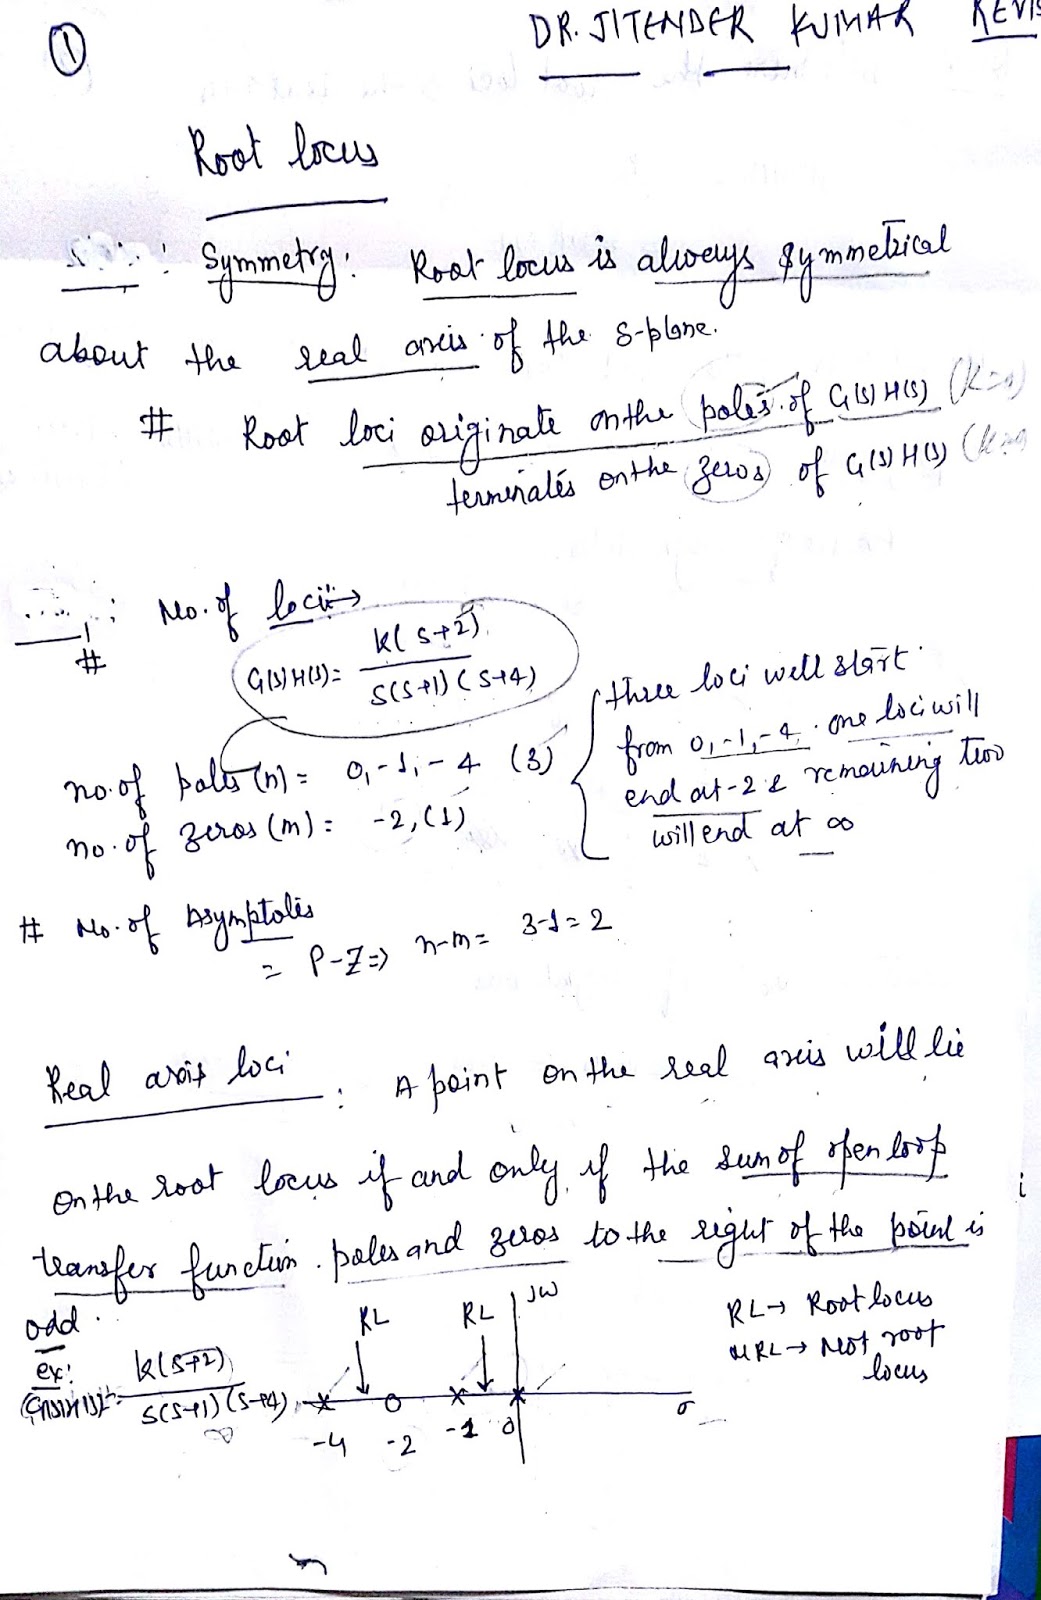
Step: 3 Find real
axis Loci .
Step: 4 Find
the number of Asymptotes and their angles, if any.
Step:
5 Determine the centre of
Asymptotes and draw.
Step: 6 Determine the break in/ away point , if
any.
Step: 7 If the locus crosses the jw axis , determine
the jw cross over.
Step: 8 Calculate the angle of departure / angle of
arrival due to complex poles or zeros if
any.
Sketch the root locus for the system . (Brief discussion)
G(s)H(s) = K(s+4)(s+5)/[(s+3)(s+1)]
Steps
step 1: m=2 (number of zeroes) , n=2 ( number of poles)
step 2: n-m=0 ; No asymptotes // no step required
Step 3: Real axis
loci [ -3 -1]
and [ -5 -4]

Step 4: 1+G(s)H(s)=0
1+ K(s+4)(s+5)/[(s+3)(s+1)]=0
K=
-(s+1)(s+3)/(s+4)(s+5)
= - s^2+4s+3/s^2+9s+20
dk/ds= - 5s^2+34s+53/[(s^2+9s+20)]^2
dk/ds=0
s=-2.42 and -4.38
Plot

Note : Root loci originate on the poles of G(s)H(s) (for K=0)
and terminates on the
zeros of G(s)H(s) (as K=∞).