Gain
Margin and Phase Margin
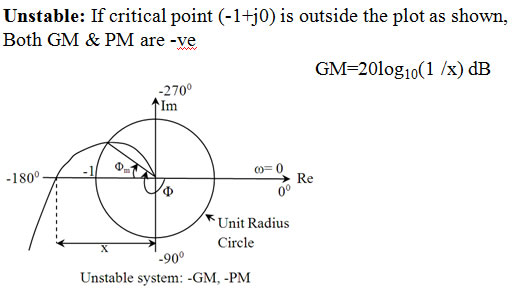
"GM/PM tells how much system can tolerate before going unstable!!! "
•Phase Margin (PM):
–Phase margin is that amount of
additional phase lag at the gain crossover frequency required to bring the
system to the verge of instability (marginally stable)
Φm=1800+Φ
Where
Φ=∠G(jωg)
if Φm>0
=> +PM (Stable System)
if Φm<0
=> -PM (Unstable System)


A Bode plot is a (semilog) plot of
the transfer function magnitude and phase angle as a function of frequency. The gain
magnitude is many times expressed in terms of decibels (dB)
A decade is defined as any 10-to-1 frequency
range
dB = 20 log10 A where A is the
amplitude or gain
Straight-line approximations of the
Bode plot may be drawn quickly from knowing the poles and zeros
–response approaches a minimum near the
zeros
–response approaches a maximum near the
poles
The overall effect of constant, zero
and pole terms
|
Term
|
Magnitude
Break
|
Asymptotic
Magnitude Slope
|
Asymptotic
Phase Shift
|
|
Constant (K)
|
N/A
|
0
|
0°
|
|
Zero
|
upward
|
+20 dB/decade
|
+ 90°
|
|
Pole
|
downward
|
–20 dB/decade
|
– 90°
|
Basic Plots : Cases


..................................................................................................................................
Note : All the data shown in this page is taken from the reference books given in your syllabus. (Ref book: Manke/ J Nagrath , B C Kuo and from google also)
..........................................................................................................................................
After reading this plz see this video for more clarification
No comments:
Post a Comment